Asset Life Cycle Report
Objective: Gain an understanding of the Asset Life Cycle report
This report displays each asset in a list, together with its network measure. Selecting assets from this list will provide users with an overview of the selected capital treatments and maintenance cost requirements for each asset over time, along with it's predicted service, native scale and risk behaviour.
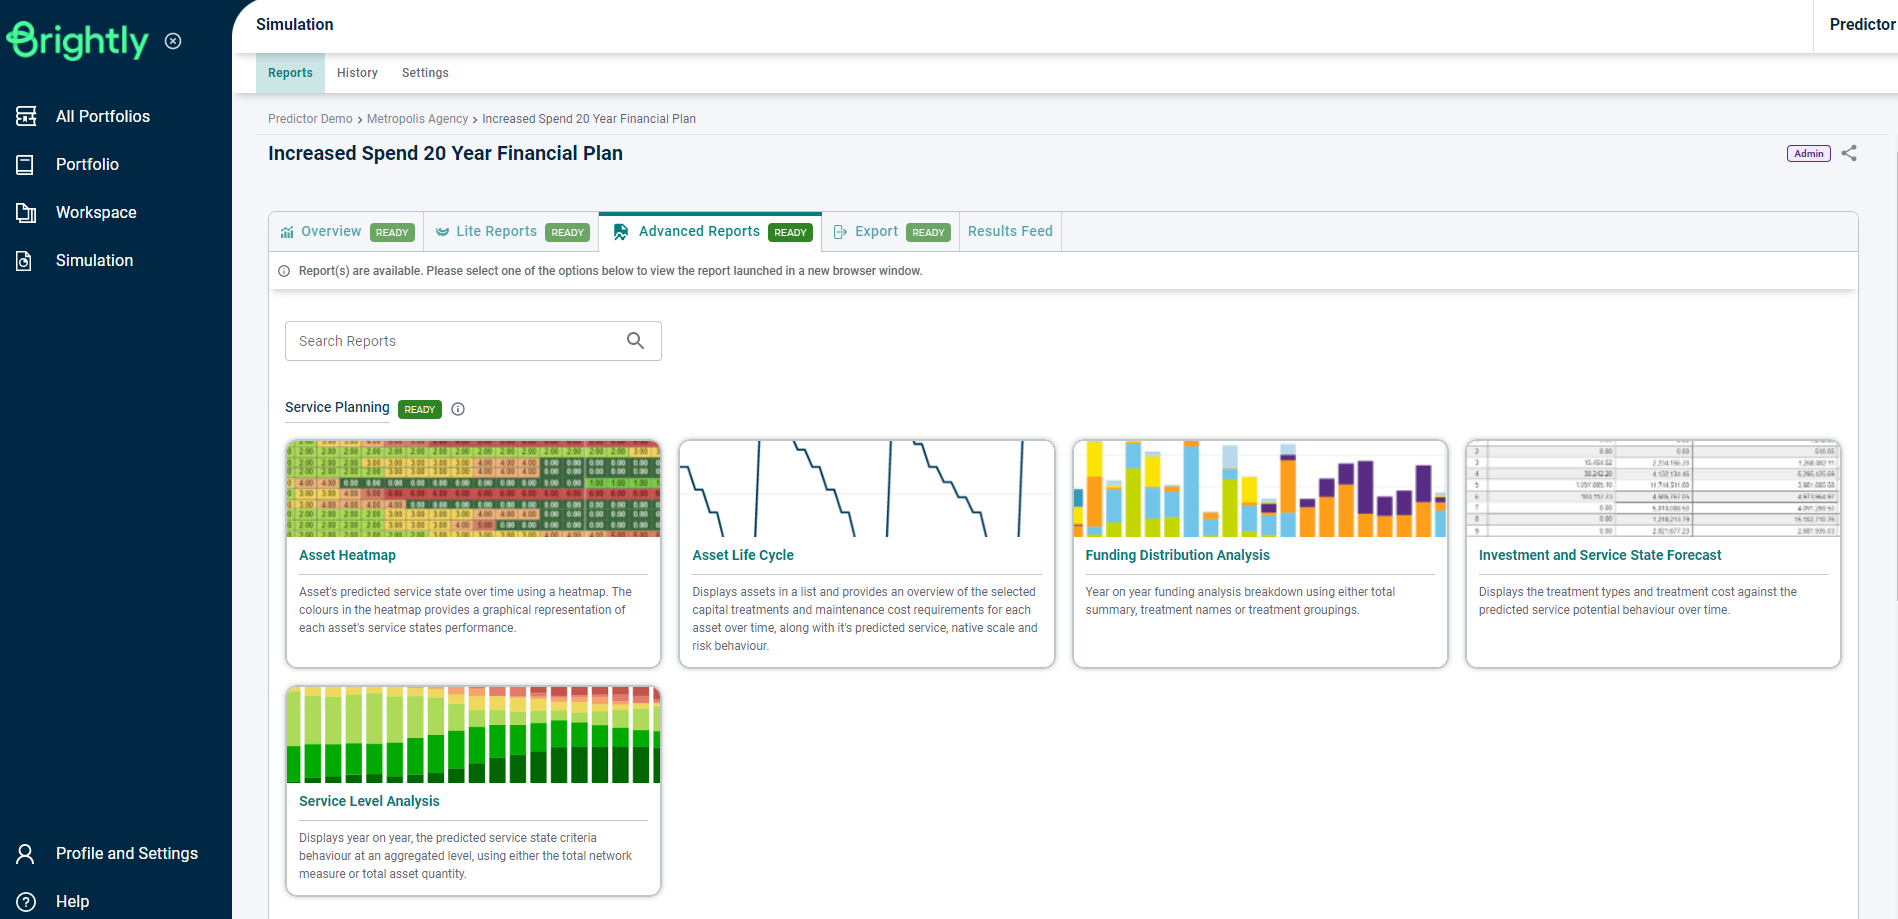
Once the Simulation is loaded, users can click on the 'Asset Life Cycle' report in the Advanced Reports tab, under the Service Planning section, or use the Search Reports box to locate the correct report.
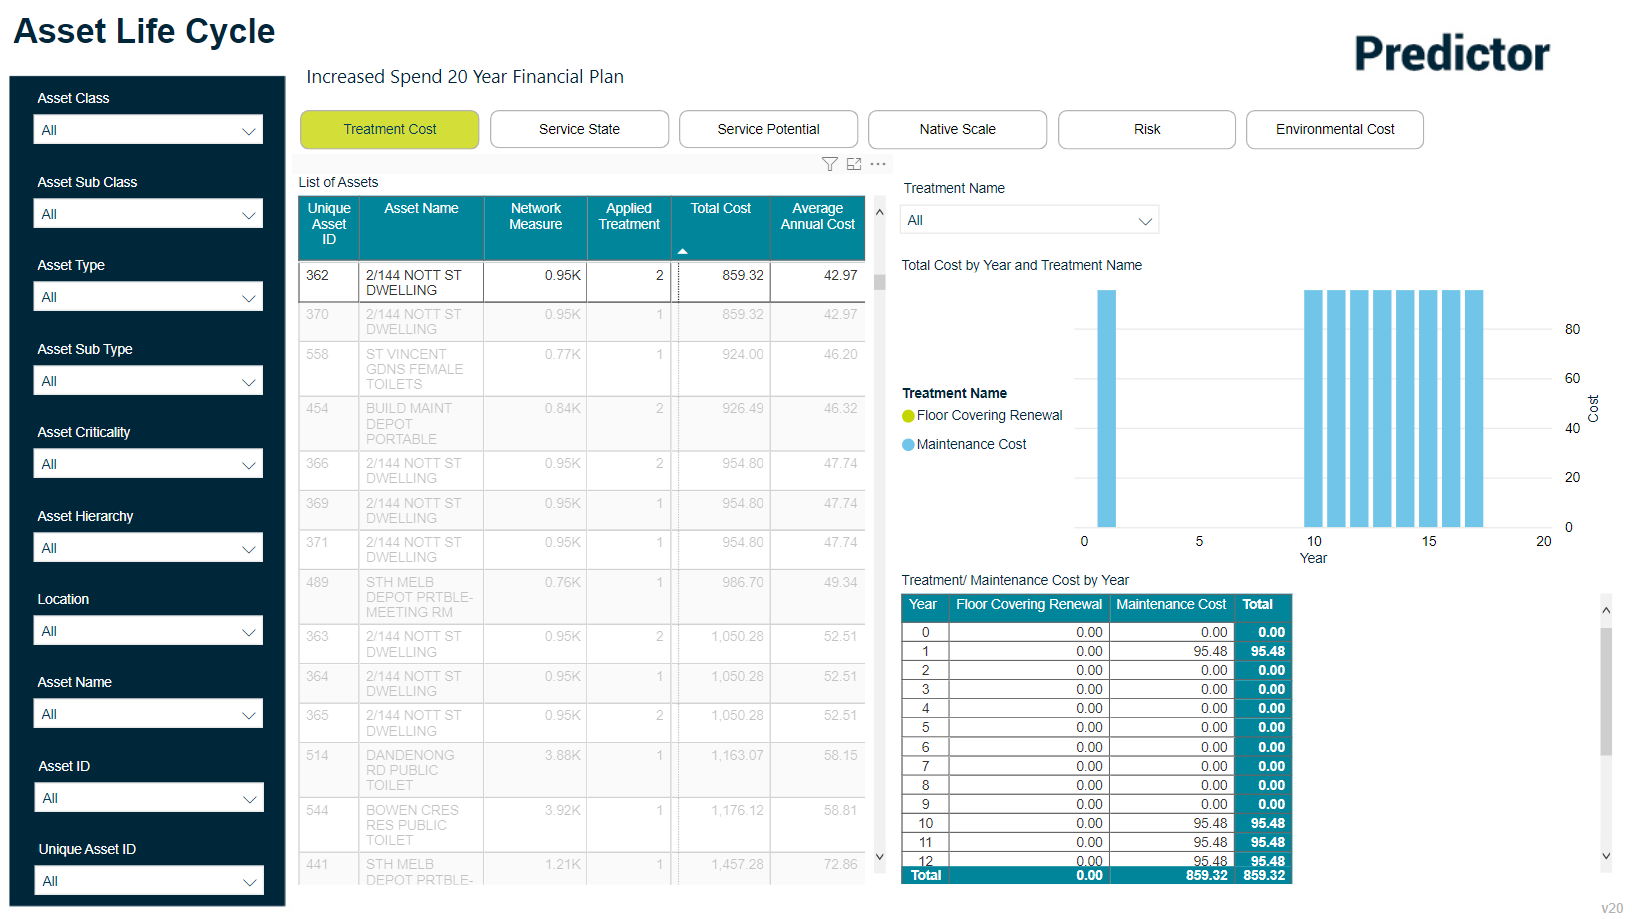
This will load the Asset Life Cycle Report in a new browser tab, which defaults to the Treatment Cost tab:
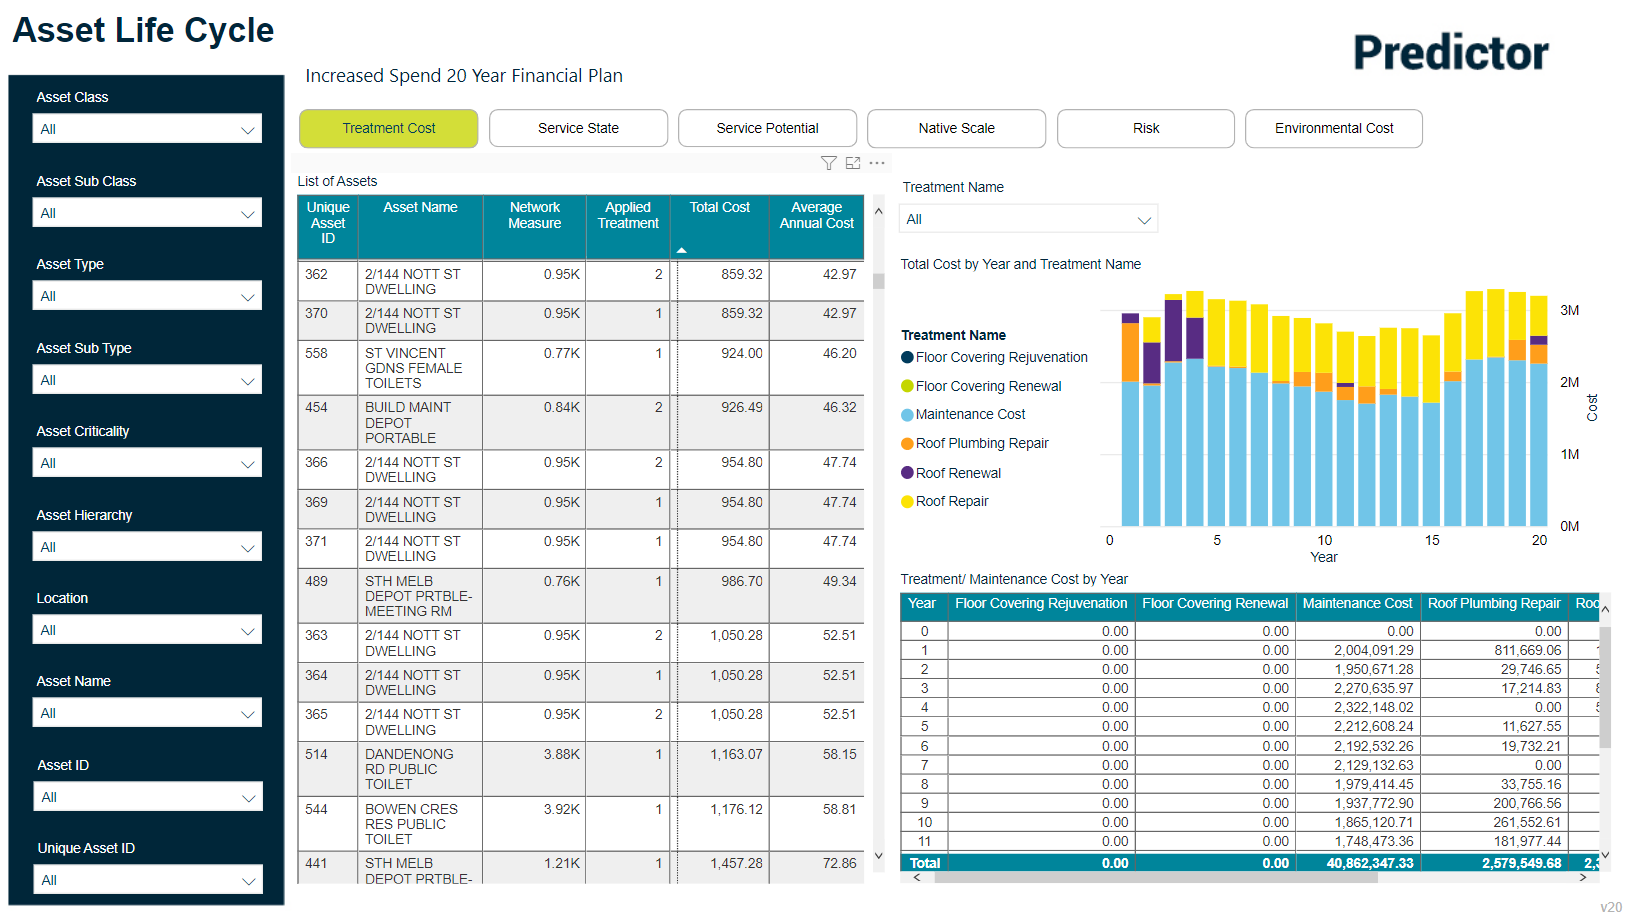
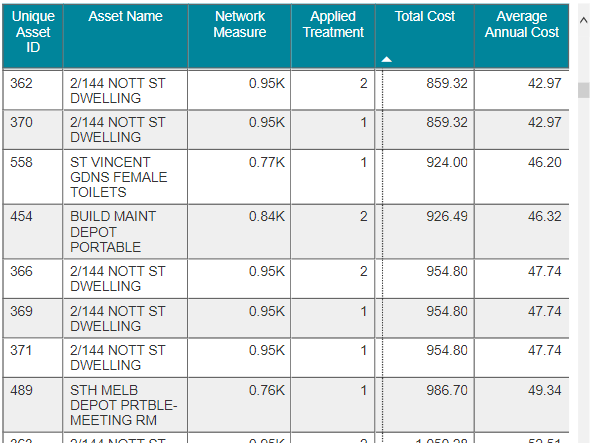
The Asset Life Cycle report will display the Network Measure, a count of Applied Treatments, Total Cost and the Average Annual Cost for assets for the total simulation year period:
Users can also drill deeper to view specific asset information for each available tab in this report by selecting an asset from the list. This allows users to view a summary of the individual asset's behaviour over the course of the entire simulation:
Treatment Cost
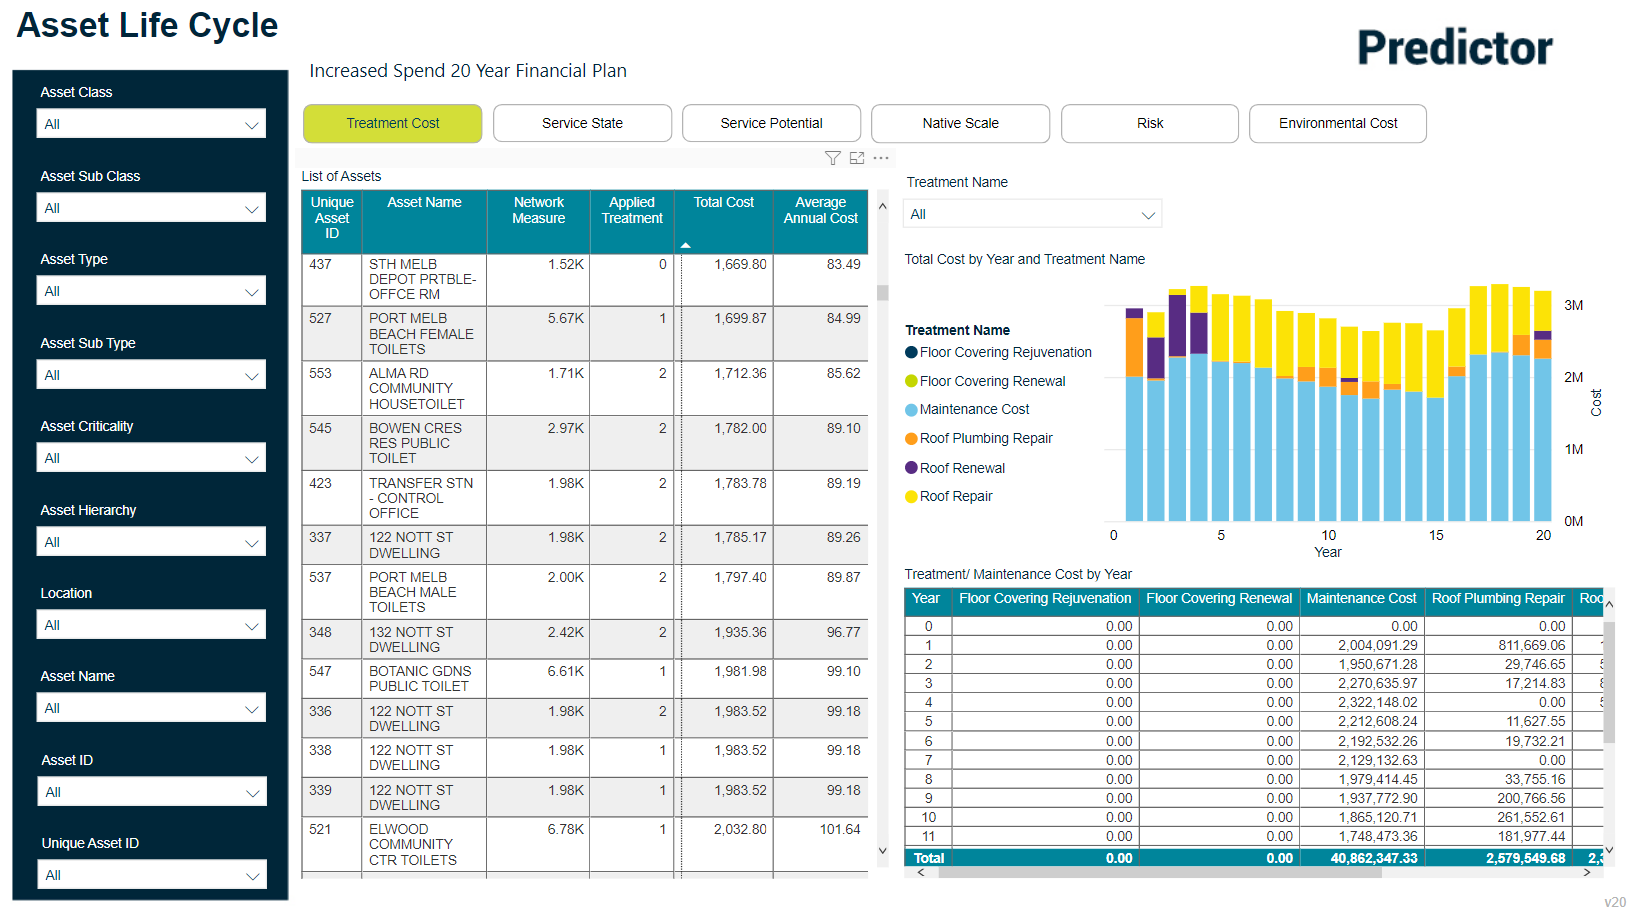
The Treatment Cost tab provides a summary of total Treatment Costs per year, grouped by the Treatment Name, and provides a cost value breakdown for each year of the simulation.
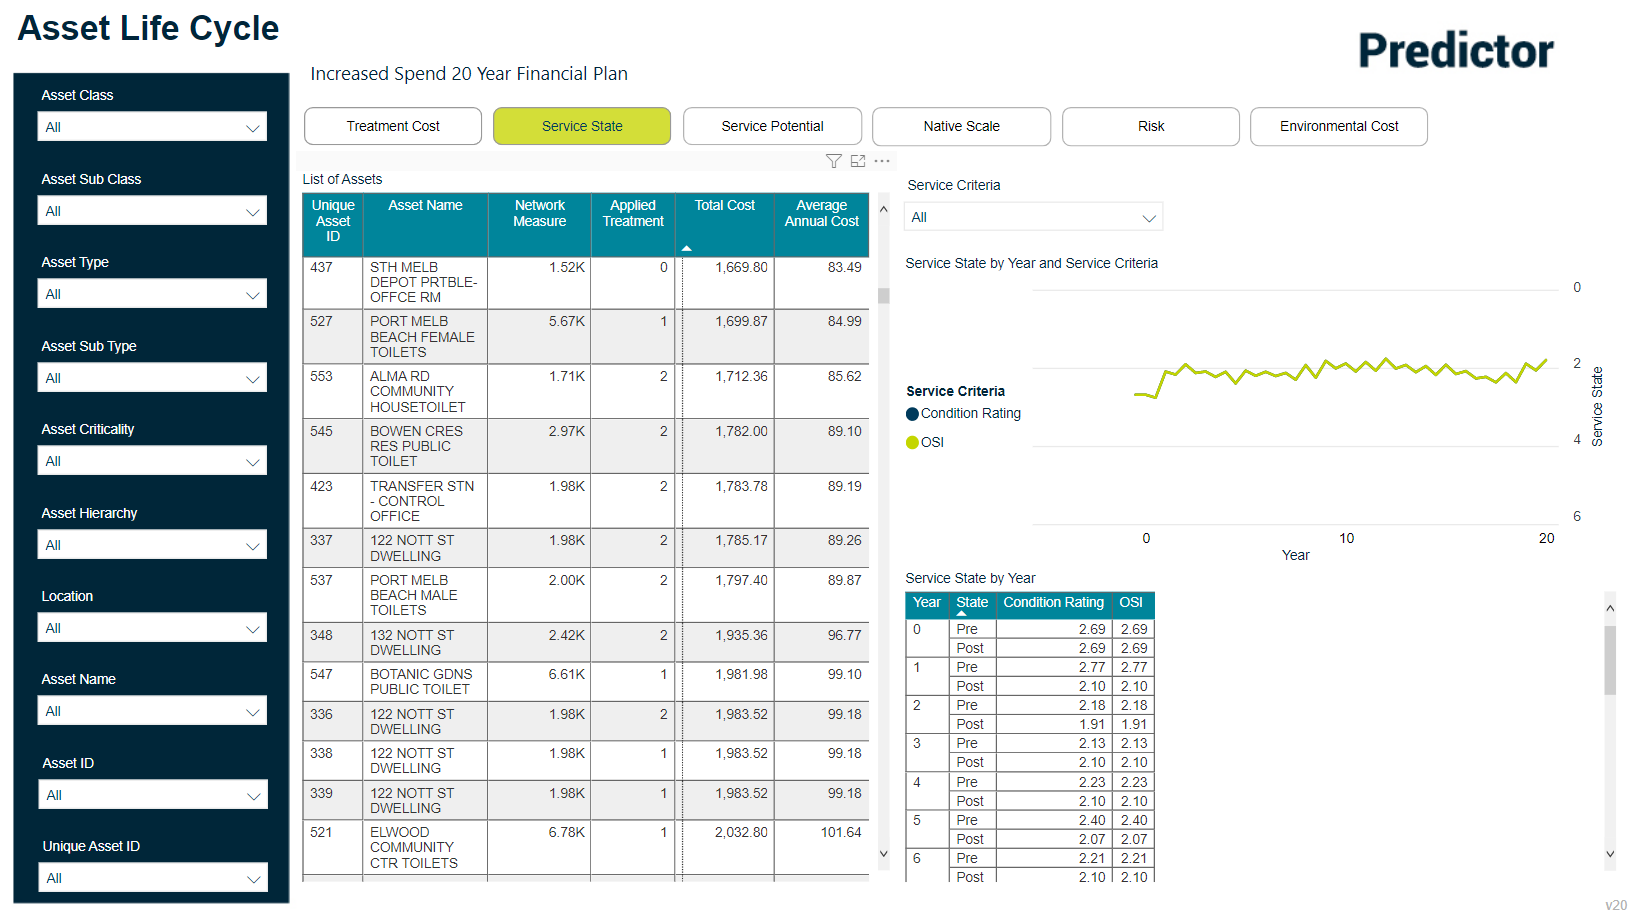
Service State
The Service State tab shows the overall service state for each year of the simulation and charts how these values are restored to a higher level following treatments for any given year. Also displayed are the service state values pre-treatment, and post-treatment, for each given year of the situation.
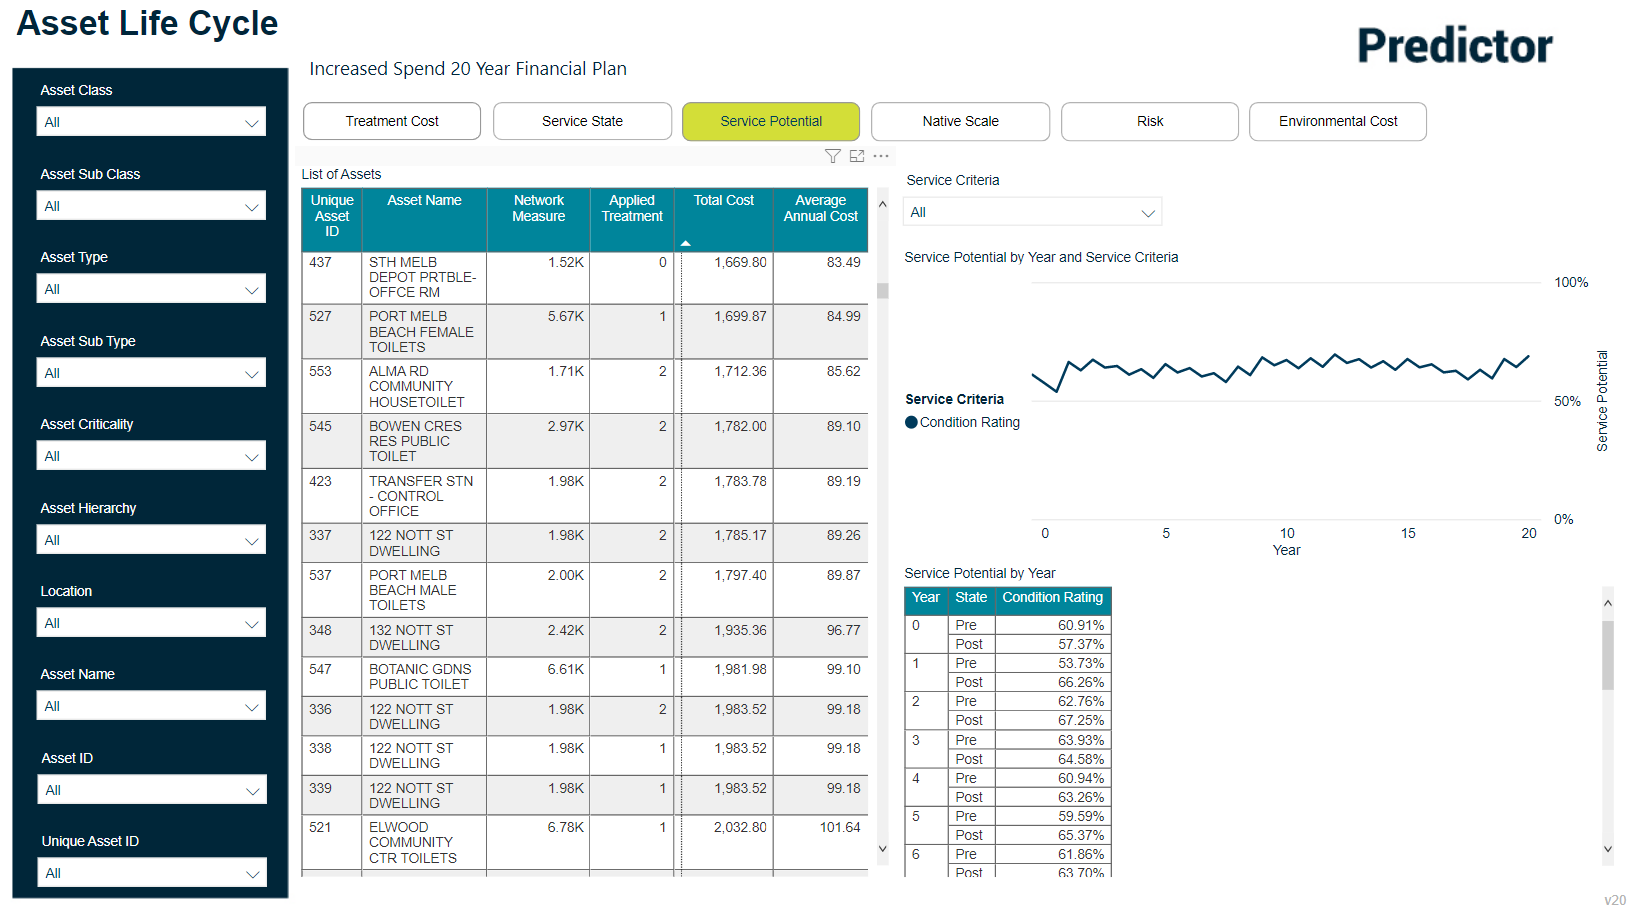
Service Potential
The Service Potential tab shows how the service potential degrades each year and also displays how the service state is restored to a higher level by performing a treatment on the asset. Also displayed is the service state pre-treatment, and post-treatment, for each given year of the situation.
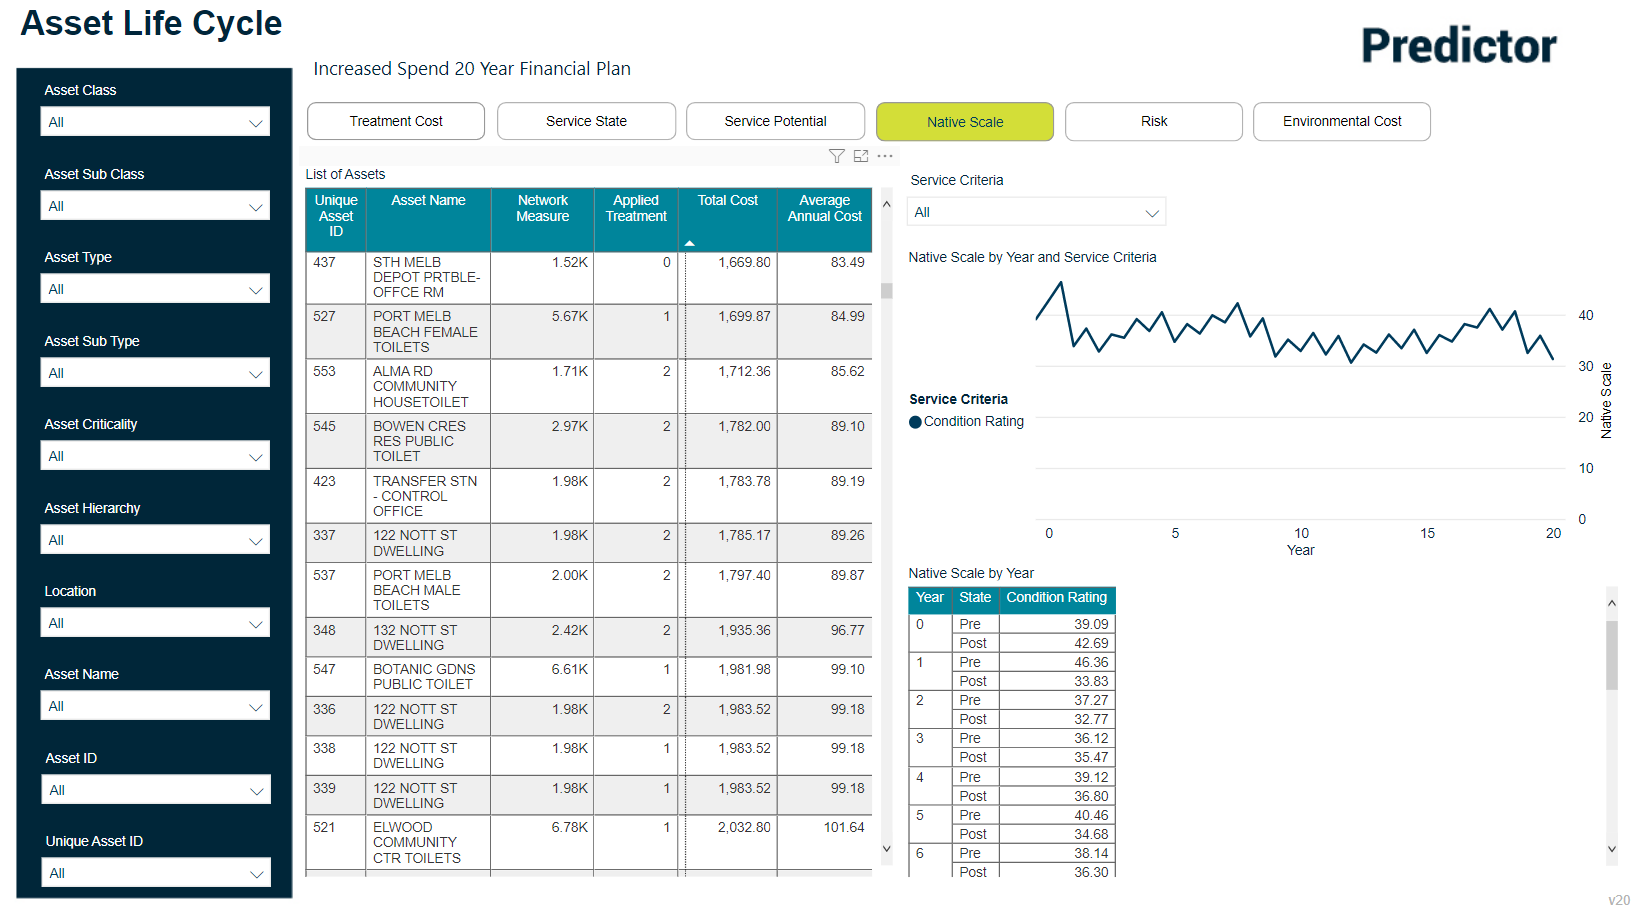
Native Scale
The Native Scale tab will show how the service level degrades over time with a defined scale that is 'native' to an organization, and also displays how the service state can be restored to a higher level by performing a treatment. Also displayed is the service state pre-treatment, and post-treatment, for each given year of the situation.
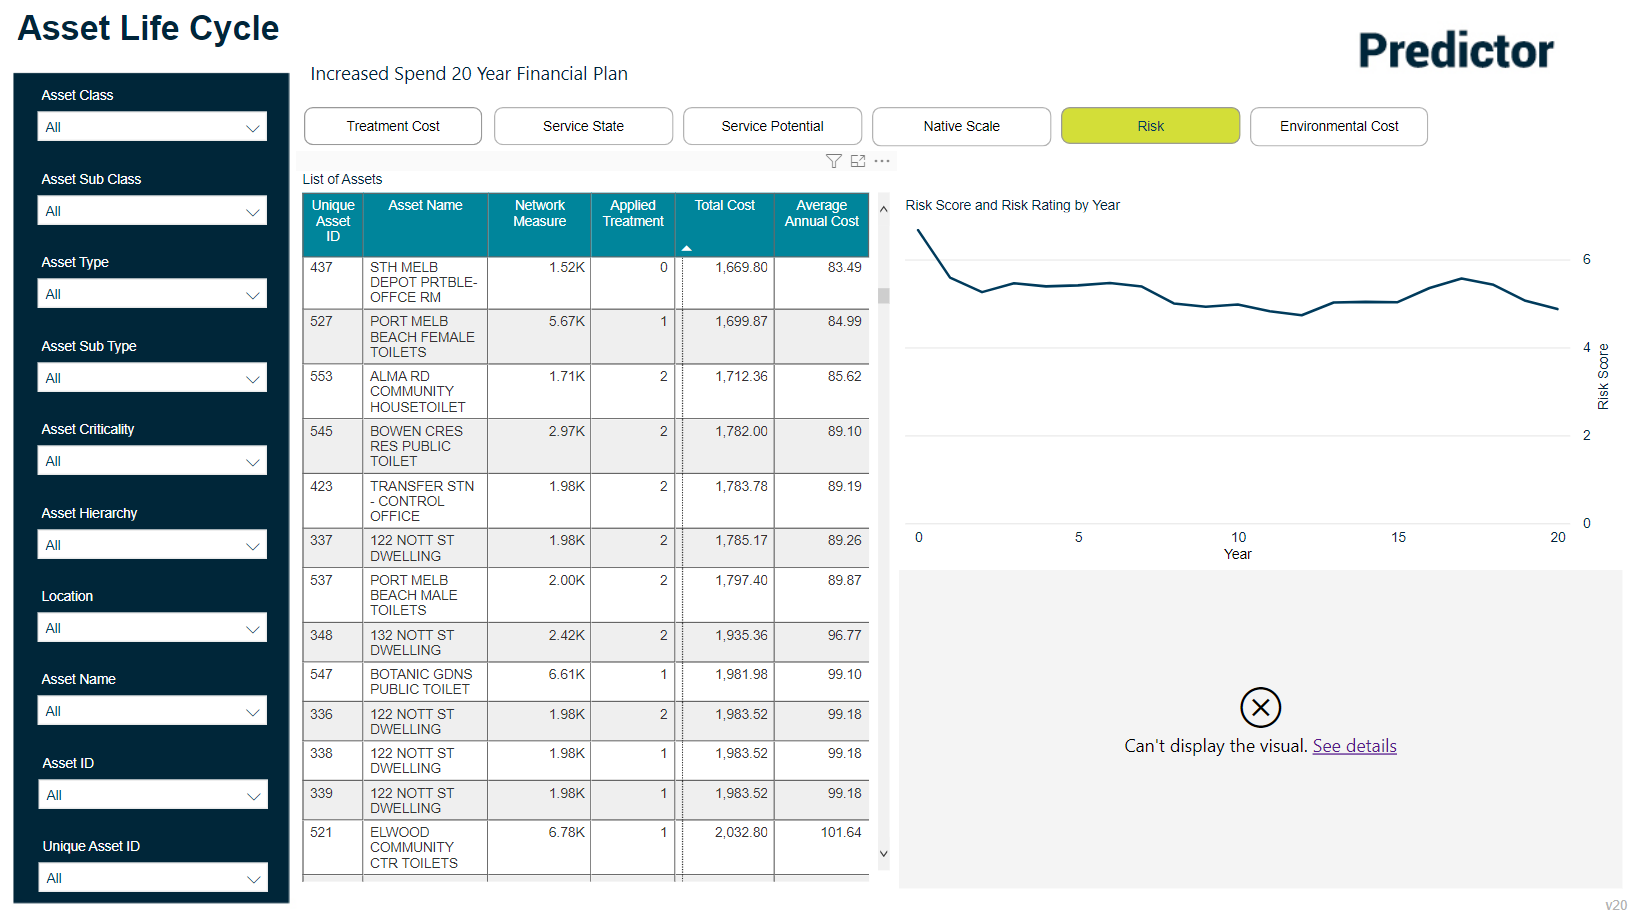
Risk
Selecting the Risk tab will show the risk score and risk rating by year for the simulation when the Risk Configuration has been used and Consequence of Failure has been mapped in the 'Setup Mapping, Scaling and Import Source Data' wizard. Also displayed is the risk rating, based on the average risk score, for each given year of the situation.
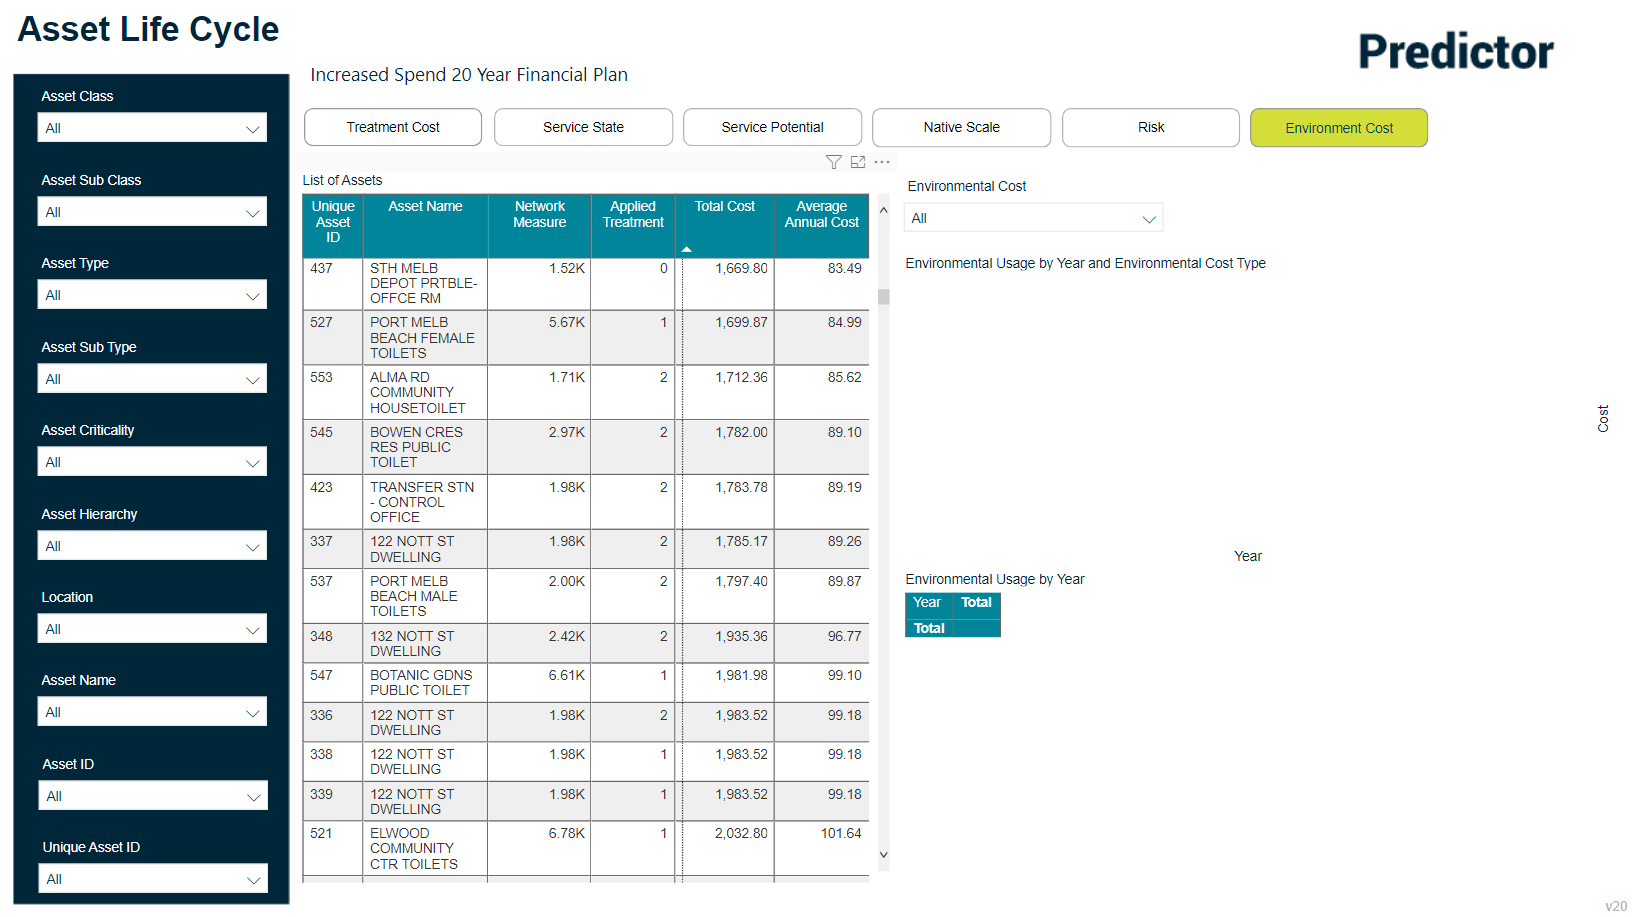
Environment Cost
Selecting the Environment Cost tab will show the total environmental usage per year for assets for all Environmental Parameters if the Environmental Costs have been configured in your simulation, and Environmental Usage Mappings have been configured when importing asset data.